Results From YDNA-Based Analysis
Group I : YDNA-Based Lineage Trees
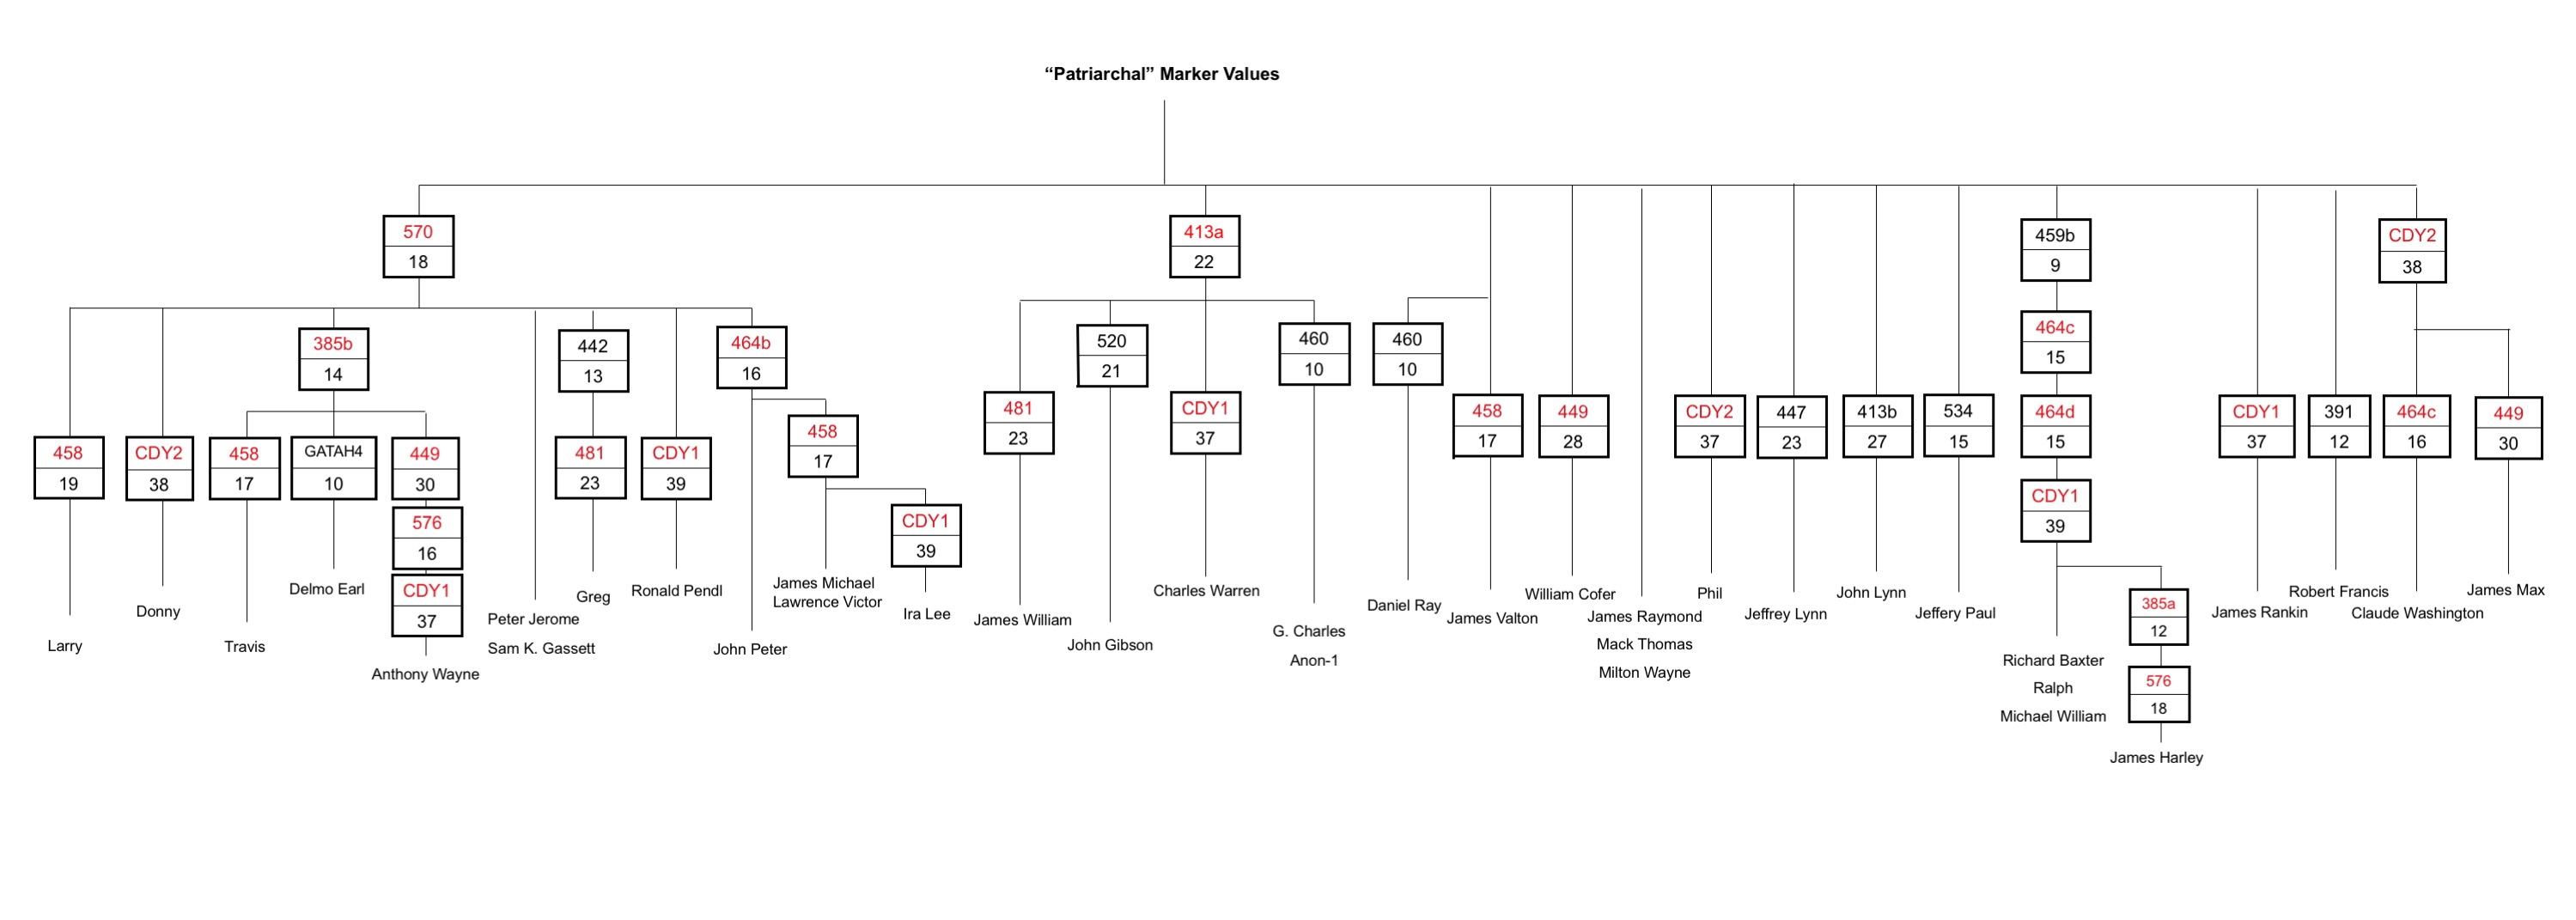
Differences in YDNA markers can be used to establish a YDNA-marker-based lineage "tree" for Group I.
Note: Click HERE to open tree in a new window at larger size.
Note: we don't yet have enough participants in Group II to warrant constructing a tree for Group II. Also note that we do not yet have enough Group-I members who have been tested to the 111-marker level (Y111) to make use of markers beyond Y67. Someday, these markers between Y67 and Y111 might prove useful for distinguishing lineages; for now, we rely on Y37 results (and Y67 results, where they exist).
For each marker, we assigned as starting or patriarchal value, the value evidenced by the majority of tested participants (i.e., the modal value) in Group I.
Though the assignment of "starting" marker values is somewhat arbitrary, assuming a different set of values would not change the relative relationships among the lineages.
You can see marker-changes in any line by following the path from patriarch to present individual. Thus, the lineage chart shows that James Michael's line has experienced changes in three markers (570, 464b and 458) in descending from patriarch to present, while Jeffrey Lynn's line has experienced change in only one marker (447) over this same time-span.
Note that the CDY markers tend to undergo change more readily perhaps than any other marker. Careful analysis of the data suggests that CDY1 has undergone six independent changes (in Anthony Wayne's line, Ronald Pendl's line, Ira Lee's line, Charles Warren's line, Ralph's line [including Richard Baxter, Michael William, and James Harley], and James Rankin's line). The decrease in marker value from 38 to 37 (in Anthony Wayne's, Charles Warren's, and James Rankin's lines) is obviously independent of the increase in marker value from 38 to 39 (in Ronald Pendl's, Ira Lee's, and Ralph's lines).
But how do we know that the three occurrences of +1 change in CDY1 were independent of one another? They must have been independent changes because there is no alternative way to reconcile other differences among Ronald Pendl's, Ira Lee's, and Ralph's lines. We have solid paper-trails from Ronald Pendl's, John Peter's, James Michael's, and Ira Lee's lines to show that Ira Lee and Ronald Pendl do not share a common ancestor less than 5 generations ago. Similarly, the many differences in other marker values between Ralph's line and the other two (Ronald Pendl's and Ira Lee's) make it difficult to draw any other conclusion.
How do we know that the two occurrences of –1 change in CDY1 were independent of each other? For example, couldn't we move the decrease in CDY1 in Charles Warren's line to a position above the change in his 413a marker, and then show James Rankin's line branching from Charles Warren's below the CDY1 marker-change (and above the relocated 413a change)? Yes, but it would then be almost impossible to reconcile the lineage of Charles Warren with the lineages of John Gibson, G. Charles, and Anon-1, who share the 413a marker-change with Charles Warren, but not the CDY1 change. One would have to accept a double change in CDY1 for John Gibson, G. Charles, and Anon-1 (first a decrease of 1, and later an increase of 1) to account for this -- or independent changes in 413a for Charles Warren, John Gibson, G. Charles, and Anon-1. Since marker 413a is a "black-font" marker (i.e., one that doesn't have a great tendency to change), we are reluctant to assume so many independent changes in it.
The CDY2 marker similarly shows four independent changes among our participants -- a change of –2 in Phil's line and a change of –1 in the lines of Claude Washington, James Max, and Donny. [Note that while only a single, shared change in CDY2 is shown in the chart above for Claude and James Max, their paper trails suggest two independent changes in CDY2 between them, as depicted in the chart below.]
We have concluded that the CDY markers are very changeable and have exhibited several, independent changes in our participants' lineages -- meaning that these CDY1 and CDY2 markers are virtually useless to us in establishing relationships among our lineages. This reminds us that we must be careful in interpreting observed changes in markers that have a tendency towards frequent change in value. The larger the marker value (i.e., the larger the allele-length), the greater the tendency to change [click here for more details]. Our CDY markers have the largest allele-lengths (38 and 39, respectively) of any markers in our suite. We should not be surprised to find independent changes in CDY markers.
Similarly, the –1 changes in marker 458 (another "red," change-prone marker) experienced by James Michael's, Travis', and James Valton's lines must be considered to have occurred independently of one another. There is no other, rational way to view the situation. James Valton's line does not share changes in markers 570 and 464b that are evident in James Michael's line -- and these two must precede (not follow) the change in 458 to make any sense of the rest of the tree (and of the paper trail). Similarly, the change in 458 within Travis' lineage must have occurred after the change in marker 385b (shared by Travis, Delmo, and Anthony, who all claim descent from Elijah b. 1788) -- a change not shared by James Michael's line.
Note that our tree also shows two independent changes in the 460 marker (in the Anon-1/G. Charles and Daniel Ray lines). Their paper-trails suggest the changes were independent. Furthermore, the only other way to explain the results would be to posit two changes in the 413a marker in Daniel Ray's line -- i.e., first a change from the patriarchal value, and then later a reversal back to the patriarchal value.
In earlier versions of such charts, a "generations-ago" scale was included on the left. However – absent an accompanying paper-trail-based model – it doesn't make much sense to include such a scale. As discussed in the accompanying tutorial on estimating time to most recent common ancestor (TMRCA), the uncertainty in estimating TMRCA is rather large – especially when a relatively few generations are involved. You can get a feeling for this by noting that, in whatever number of generations actually has transpired from the patriarch to today, some lines have experienced no marker-change (e.g., James Raymond's), while others have experienced as many as six marker-changes (e.g., James Harley's). Therefore, whatever "average" number of generations is thought to occur between marker changes, the variance must be rather large to account for these differences. And there is no assumption of starting values that eliminates such discrepancy in marker-changes among the lines. Employing a different set of starting values merely rearranges the maldistribution of numbers of marker-changes among the lines.
It should be emphasized that the locations of branch points on the vertical scale are just educated guesses – you should not place too much credence in them without a paper-trail to overlay. Likewise, the vertical locations of the marker-changes are arbitrary. All we can know for sure is that the marker change must have occurred at – or later than – a branch-point. [For more on this issue, click here.]
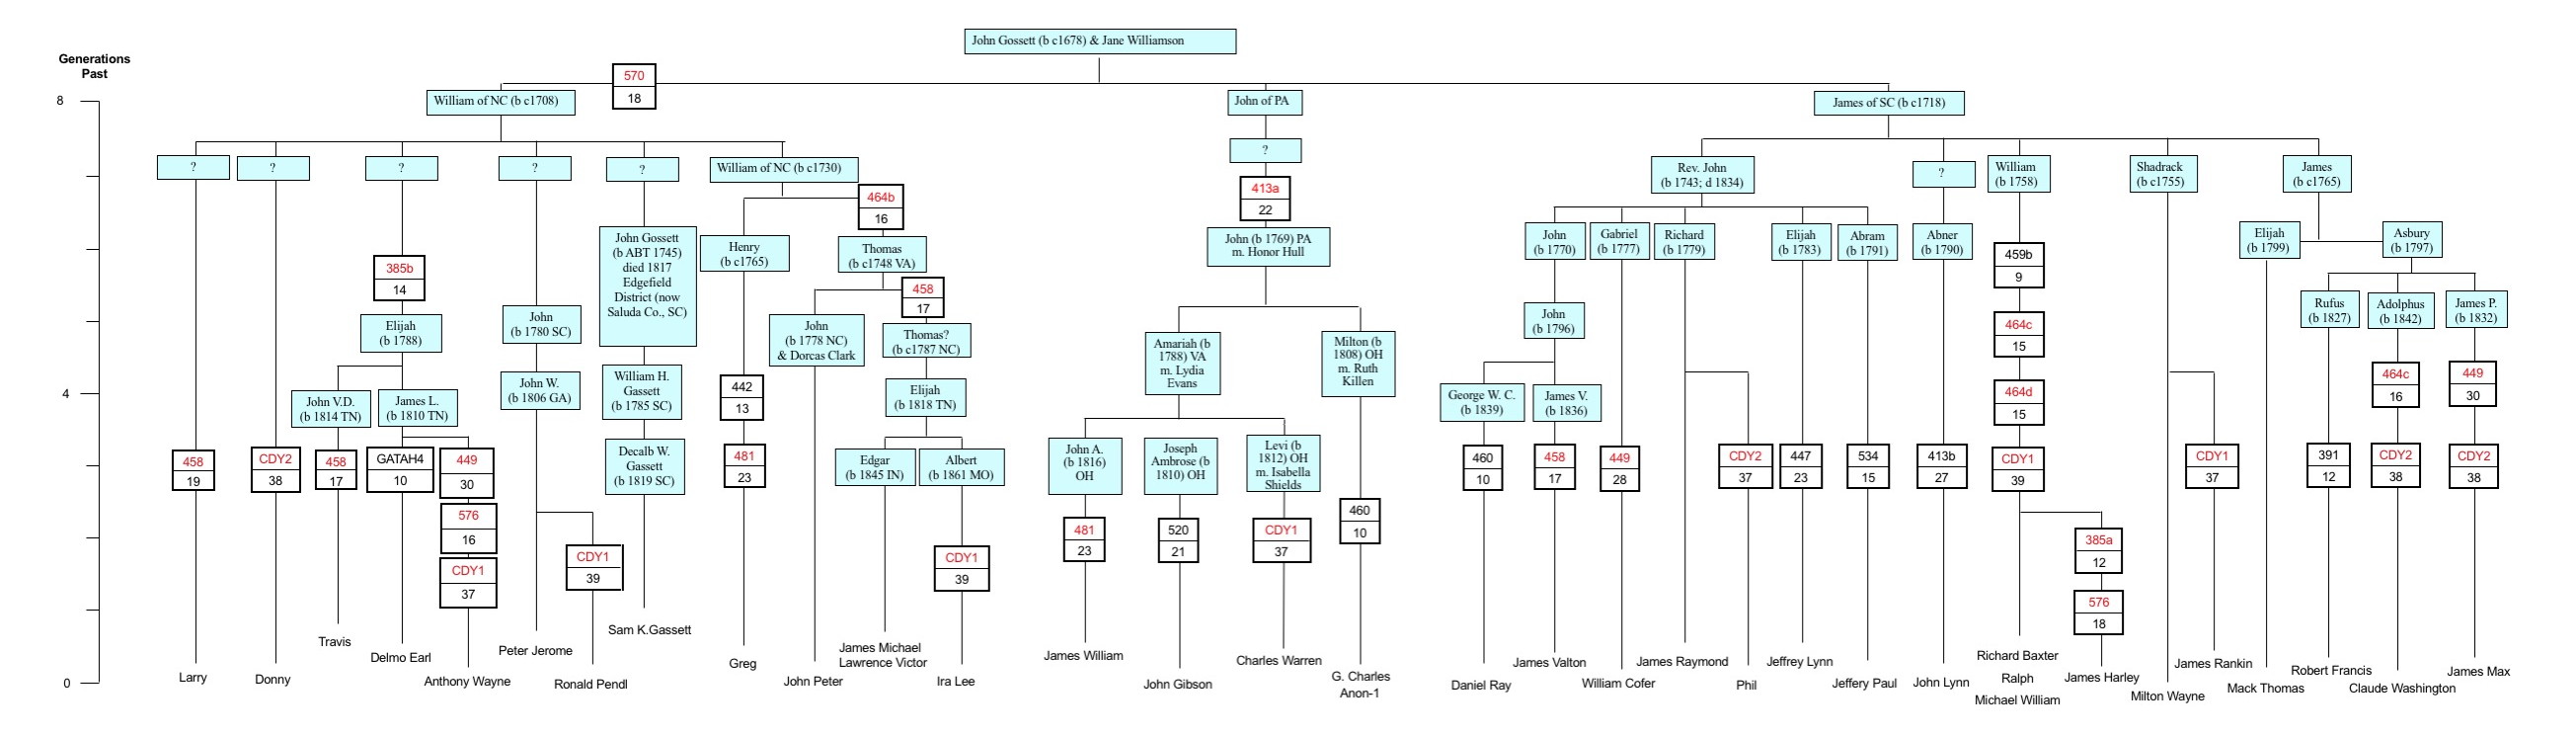
One interesting and useful thing that can be done with YDNA-based lineage charts is to attempt their combination with knowledge from paper-trails or with hypothetical lineages. We hypothesize [with supporting arguments presented elsewhere on this site] that the Group-I Gossetts in America descend from John Gossett (b. ca. 1678) and Jane Williamson of Newcastle Co./DE. [Note that this d.o.b. agrees very well with the analysis presented on the previous page, in which the patriarch's d.o.b. was estimated.] John of DE is known to have had at least three sons — John, James (or Jacob) and William. We additionally suggest that John of PA (the ancestor of Charles Warren) is the John who was son of John and Jane of DE. Furthermore, their son William (b. ca. 1710s) is likely the same William who settled in Guilford Co./NC [Go here for more details]. We can overlay this assumed lineage on the YDNA-based lineage:
Note: Click HERE to open tree in a new window at larger size.
In doing so, we have attempted agreement with the "generations" time-scale on the left. [Note: Because of the great difference in ages among our current project participants – some are old enough to be the grandfathers of others – and because years between generations differ among the different lines, we have arbitrarily declared ancestors born ca. 1780 to be of "generation 5" in the chart above. Thus, in some cases, a project participant might find some discrepancy between the generations-ago of a known ancestor and his appearance in the chart above.]
Note that placement of participants in the chart above has been guided by their YDNA results, but also considerably by their "paper-trails." Thus, although James Raymond, Mack Thomas, and Milton Wayne show identical YDNA results at the 37-marker level, we have shown them descended from different sons of James of SC (b c1718), in accordance with what they tell us of their ancestries from family records. This brings up an important point: Many of our participants on the right side of the chart show one or fewer marker-changes in descent from their presumed common ancestor [James of SC (b c1718)]. With so few changes, fine resolution of their lineages is not possible from YDNA analysis alone. We know they are all more closely related to one another than they are to participants appearing on the left side of the chart, but we cannot place them as descended from particular sons and grandsons of James based upon genetic analysis -- they're simply too similar with respect to YDNA markers.
The YDNA results certainly suggest that Larry, Donny, Travis, Delmo Earl, Anthony Wayne, Peter Jerome, Ronald Pendl, Sam K. Gassett, Greg, John Peter, JamesMichael/LawrenceVictor, and Ira Lee are more closely related to one another than to the other project participants (by virtue of the shared difference in marker 570 -- it essentially divides the tree in half). If, indeed, these participants on the left-hand side of the tree are descended from William of NC, then there remain questions that should be the focus of additional research: How do Elijah (b. 1788), John (b. 1780 SC), John (b. 1778 NC) and Elijah (b. 1818 TN) link into the descendency from William of NC? William of NC (b. c1710s) had many sons, who in turn had many more sons – do we really know enough about all of them? These puzzles (and speculative solutions) are discussed in more detail here.
The participation of Sam K. Gassett in our project is particularly noteworthy. His YDNA results clearly show him to be a Group-I Gossett, supporting a long-held hypothesis that Gossett and Gassett surnames share relatively recent, common ancestry.
John Lynn traces his lineage back to Abner (b. 1790 SC). In the model we have shown him to be descended from an unidentified brother of the Rev. John. We're unaware of a paper-trail that confirms this – therefore, it's yet another suggested area for research. We have depicted William (b. 1758), Shadrack (b. c1755), and James (b. c1760) to be brothers of the Rev. John (and all sons of James b. c1718) -- and indeed it is possible that Abner is one of their sons. The paper trail is not clear on the relationships among the Rev. John, William, Shadrack, and James -- though their geographical proximity suggests they might have been brothers. It is also possible that, through further investigation, some of the putative sons of the Rev. John might prove, instead, to be his nephews.
Some participants have wondered whether the above model is consistent with assumed rates of marker-change – i.e., could so many changes have occurred within 8 or 9 generations? Our best answer is that the YDNA data are not inconsistent with the above model, as should be evident if you examine the 5% probability Table presented here. Statisticians tend not to reject a hypothesis unless its probability of being correct is less than 5% (i.e., a 95% confidence in rejection). James Harley -- the Group-I member with the greatest genetic distance from the rest -- nonetheless have a 5% probability of a TMRCA less than 330 years when paired with nearly all Group-I members -- a result that puts him within reach of John of New Castle County, DE.
Bottom line: Nothing in the YDNA data statistically demands that the model be rejected. And the evidence from conventional genealogical research, presented elsewhere on this site, makes the hypothesis convincing -- far more convincing than is the evidence for descent from Jean of Jersey Isle.
Stay tuned!
Return to Homepage ![]() Previous Page Next: The Group-II Conundrum
Previous Page Next: The Group-II Conundrum ![]()