Evaluation of The Method:
Comparing Estimated and Measured %ABV
© James M.
Gossett (March 31, 2012) Questions/Comments? ![]()
![]() Stoichiometry of Ethanol Production From Maltose
Stoichiometry of Ethanol Production From Maltose
![]() Contribution of Ethanol to Apparent Brix
Contribution of Ethanol to Apparent Brix
![]() Measurement of %ABV Using Brix Refractometry
Measurement of %ABV Using Brix Refractometry
![]() Derivation of Calculator Equations
Derivation of Calculator Equations
![]() Evaluation of The Method: Comparing Estimated and Measured %ABV
Evaluation of The Method: Comparing Estimated and Measured %ABV
My refractometer-based method for estimating
%ABV from pre- and post-fermenation Brix was evaluated using a dataset of 12 beers. Results were compared to
experimentally measured %ABV data.
Note that most of my brewing is of fairly high-gravity beers –
Northern Ale, Double IPA (DIPA), Honey Malt Ale, Belgian Tripel; consequently, the dataset is skewed
towards the high end of %ABV. There
is also one apple cider among the set.
Two of the samples (DIPA-1a and 1b) were actually of the same beer,
sampled months apart.
%ABV
Figure 1 presents comparison of
Brix-estimated vs. measured %ABV.
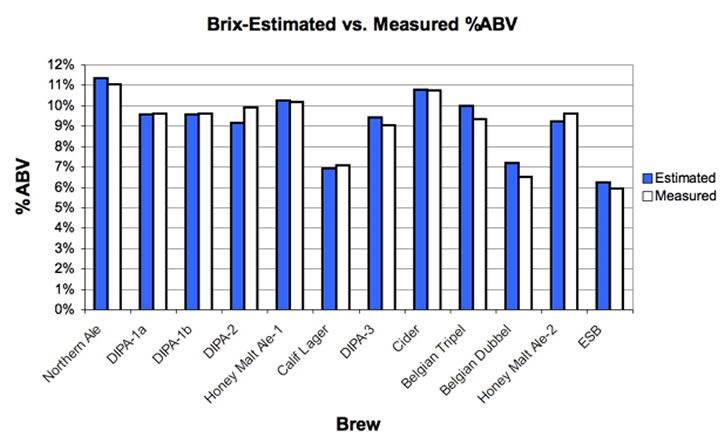
Figure
1. Comparison of Brix-based modeled
vs. measured %ABV for a dataset of 12 brews.
The summary statistics are: mean difference = 0.1 %ABV; sample
standard deviation of the difference (n=12) = ±0.4 %ABV. Thus, one can reasonably
expect to estimate %ABV, for home-brewing purposes, with the Brix-based
calculator. Commercial brewers
would likely feel the need for more accuracy.
The mean difference and
sample standard deviation of the difference reflect some combination of
imprecision and inaccuracy – in both the model-based estimates and in the
experimental measures of %ABV. We
are comparing the model-based estimates to imperfect measures of “actual
%ABV.” As reported earlier, the
standard deviation of the method used here for measuring alcohol content is ±
0.2 %ABV. And imprecision in reading
the Brix scale affects model estimates of %ABV, just as it does experimental
measures of %ABV: the refractometer
cannot be read more precisely than to ± 0.1 Brix. That sort of imprecision in reading
the Brix scale propagates to an imprecision in model-estimated alcohol values
of about 0.1% ABV. Putting these sources together,
it’s not hard to understand why imprecision in the difference between
Brix-estimated model and measured alcohols would be as high as ± 0.4% ABV.
Residual Real Extract
Figure 2 presents Brix-based
calculator estimates of residual Real Extract (Pf) versus “measured”
values.
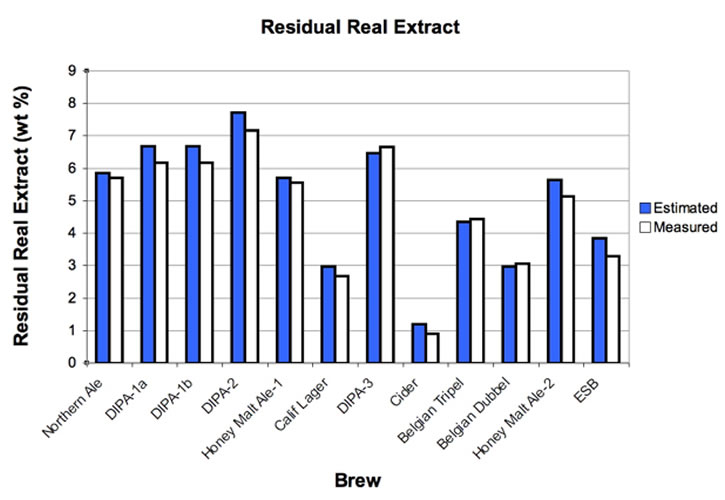
Figure
2. Comparison of
Brix-based modeled vs. “measured” residual real extract.
What I am referring to as
“measured” residual RE is not quite that.
It’s not based on specific analysis of carbohydrates, via HPLC or some
wet-chemical technique (e.g. anthrone reagent). As presented elsewhere, it is based on Brix measurement (Bf
aft boil/reconst) of the beer after boiling off 75-80% of its volume (to remove EtOH)
and replacing it with distilled water.
If we assume that the factor of 1.04 between initial Brix (Bi)
and initial extract (Pi) in pre-fermented wort represents
non-carbohydrate constituents that contributed to initial Brix; and that these
remain after fermentation; then
residual RE “meas”
= Bf aft boil/reconst – (Bi –Bi/1.04)*(OG/SGf
aft boil/reconst)
The factor (Bi
–Bi/1.04) represents the grams of non-carbohydrate
contribution to original Brix (Bi) and the ratio (OG/SGf aft
boil/reconst) corrects for the difference in specific gravity between
original, pre-fermentation wort (when the Bi measurement was made)
and the specific gravity of the post-fermentation beer after
boil/reconstitution (when the Bf aft boil/reconst
measurement was made). It is
necessary because the reference on which weight% is based has changed. The same mass of nonfermentable
carbohydrates in 100 g of original wort at (for example) SG = 1.050 will
contribute a greater extent of weight% to a post-fermentation beer, after
boil/reconstitution, with (for example) SG =1.010.
The model-estimated residual
RE compares reasonably well with the “measured” residual RE.
Final Brix, After Boiling/Restoration
For those who would prefer to
model the final Brix measured on the post-fermentation beer, after boiling off
75-80% of its volume and restoring with distilled water, I present Figure 3.
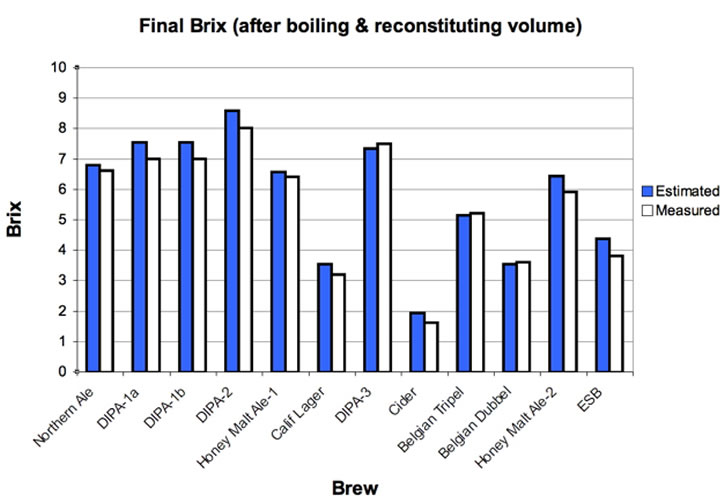
Figure 3. Comparison
of Brix-based modeled vs. measured residual Brix (after
boiling/reconstitution).
Comparison With Hydrometer-Based Methods
of %ABV Estimation
There are many
hydrometer-based methods to estimate %ABV in finished beers. I chose only four of them for
comparison to my Brix-based method.
Standard SG-Drop Method
From the FermCalc website
http://web2.airmail.net/sgross/fermcalc/fermcalc_alcohol.html
“…Described on pages 79-80 of First Steps
in Winemaking by C. J. J. Berry (1987). It estimates the alcohol content by
dividing the drop in specific gravity by the constant 0.00736,” or:
|
av = (sgi - sgf)
/ 0.00736 |
where
av = alcohol
content, % by volume
sgi = initial specific gravity
sgf = final specific gravity
Miller
From Dave Miller
(The Complete Handbook of Homebrewing,
1988, Storey Communications. Miller
uses the same formula as the Standard, SG-Drop Method above, except the factor
in denominator is 0.0075.
Duncan and Acton
From the FermCalc website
http://web2.airmail.net/sgross/fermcalc/fermcalc_alcohol.html
“This method is
described on pages 64-66 of Progressive Winemaking by Peter Duncan and
Bryan Acton (1967).”
|
av = 1000(sgi
- sgf) / [7.75 - 3.75(sgi - 1.007)] |
Realbeer.com
http://www.realbeer.com/library/beerbreak/archives/beerbreak0301.php
Gives %ABW
ABW = 76.08(OG-FG)/(1.775-OG)
which
I then converted to %ABV by %ABV = %ABW*FG/0.794, where 0.794 is the density of
EtOH at 15˚C.
I
used each of the four hydrometer-based methods to estimate %ABV in the 12
finished beers. Because my FG
hydrometer measurements were made on finished, bottle-conditioned beer, I added
0.0036 to OG (pre-fermentation) hydrometer measurements to include the effects
of 5 oz/gal bottling sugar.
Figure
4 presents the results, with both my Brix-based, model predictions and measured
%ABV shown for comparison.
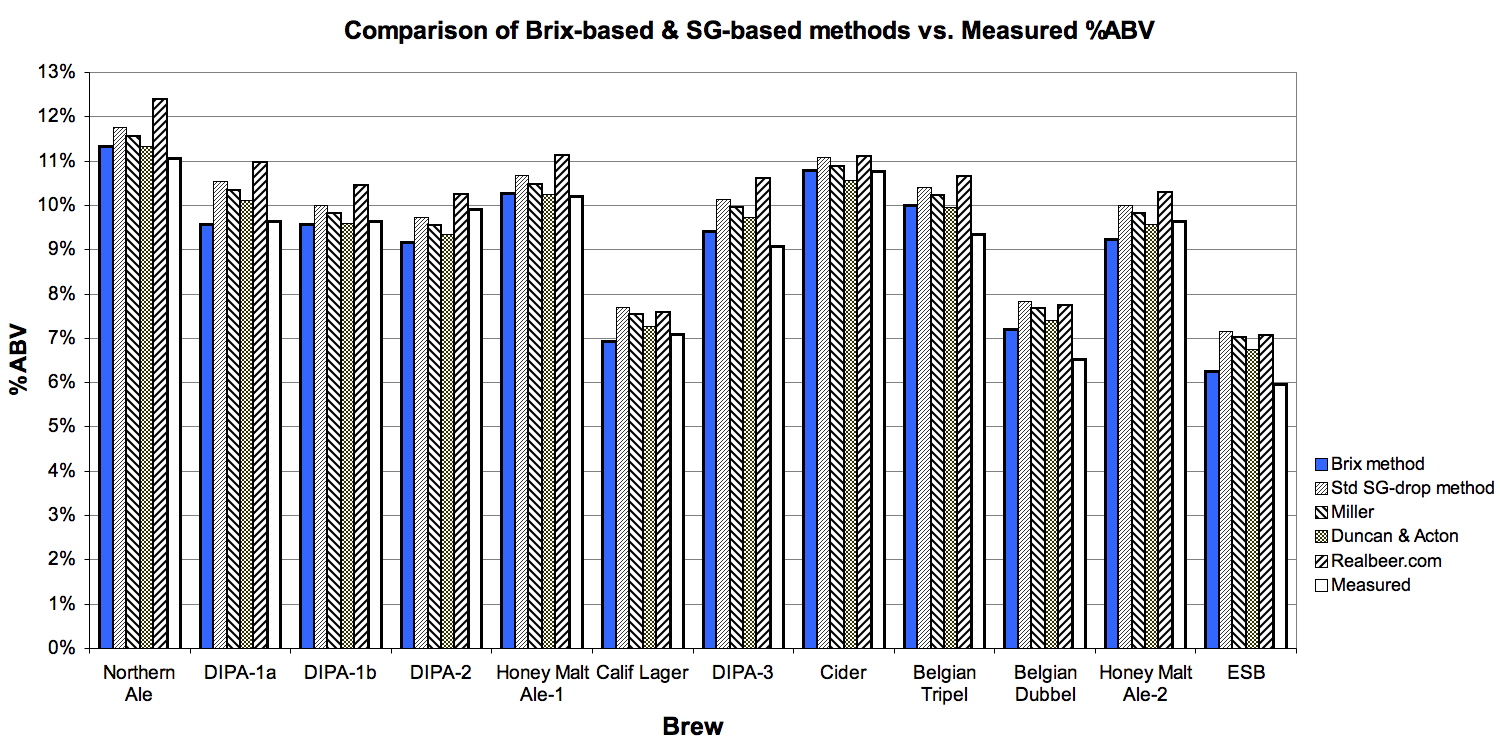
Figure 4. Comparison of Brix-based method and four
hydrometer-based methods with measured %ABV,
If the measured %ABV values are to be believed, the
Brix-based method appears at least as accurate as any of the hydrometer-based
methods.
The data are presented in an alternative way in Figure
5.
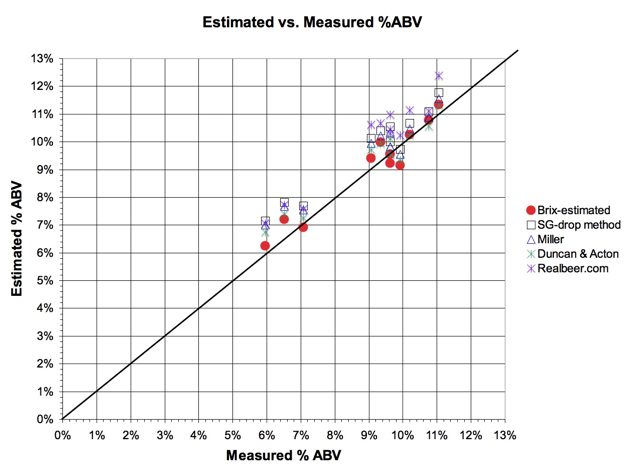
Figure 5. Scatter plot of estimated vs. measured
The four, hydrometer-based methods tend to
over-estimate %ABV. As presented
earlier, the mean error (from measured %ABV) of the Brix-based method was +0.1
%ABV, with sample standard deviation (n=12) of ±0.4 %ABV.
It is, of course, up to prospective users whether this
level of accuracy and precision is sufficient for their needs. However, consider that similar analysis of most hydrometer-based
methods is not readily available.

![]() Derivation of Calculator Equations
Derivation of Calculator Equations