Contribution of Ethanol to Brix Measurements and
Measurement of %ABV Using Brix Refractometry
© James M.
Gossett (March 25, 2012) Questions/Comments?
![]()
![]() Stoichiometry of Ethanol Production From Maltose
Stoichiometry of Ethanol Production From Maltose
![]() Contribution of EtOH to Apparent Brix
Contribution of EtOH to Apparent Brix
![]() Measurement of %ABV Using Brix Refractometry
Measurement of %ABV Using Brix Refractometry
![]() Derivation of Calculator Equations
Derivation of Calculator Equations
![]() Evaluation of The Method: Comparing Estimated and Measured %ABV
Evaluation of The Method: Comparing Estimated and Measured %ABV
Consideration of two factors is required to estimate
ethanol (EtOH) production
from initial and final refractometer
(Brix) measurements:
(i) the
stoichiometry of maltose fermentation to EtOH; and
(ii)
the contribution that the
resulting EtOH makes to
Brix.
In this section, the effect of EtOH
on Brix measurements is considered.
Quantifying this effect is not only integral to the Brix-based calculator for estimating %ABV from pre- and post-fermentation refractometer readings; it also enables an analytical method for measuring %ABV from
Brix refractometry. Such a method is described and evaluated
below, using standard additions of EtOH to two different background matrices: an aqueous solution
of sucrose; and a commercial beer.
Like sugars, EtOH in
solution will give an apparent Brix value that is dependent upon its
concentration. Thus, while
Brix is expected to decline through fermentation as sugar is consumed, the
effect is mitigated by the positive contributions to Brix measurements from the
resulting EtOH produced in fermentation. Though Brix superficially reports
“% (w/w) sugar” in wort, the difference between
initial and final Brix readings will underestimate
the quantity of sugar consumed by yeast, since the final readings will be
elevated by the presence of EtOH.
This is the opposite problem one encounters using
hydrometers to measure specific gravity (SG). In that case, the difference between
initial SG (or original gravity, OG) and final SG (or final gravity, FG) will overestimate the quantity of sugar
consumed by yeast, since the final SG reading will be depressed by the presence
of EtOH, since it is less dense than water.
I experimentally measured the contribution that EtOH makes to Brix measurements by creating EtOH standards of known % alcohol by volume (%ABV)
– both in distilled water and in water with a constant background of 5 g
sucrose/100 mL.
Materials and Methods
EtOH used was ACS grade, ≥ 99.5% pure (Sigma-Aldrich). It, and the distilled water used in these
experiments, were stored at 15˚C (59˚F), the standard temperature at which %ABV
is referenced and at which hydrometer readings are normally reported. Standards were prepared in 100-mL glass
volumetric flasks at 15˚C. Ordinary
cane sugar was used; it was neither oven-dried nor stored in a desiccator. Therefore, its purity was not
assured. However, all that was
required in these experiments is that the volumetric concentration of sucrose
be uniform among standards that contained sucrose. Sucrose masses were weighed to the
nearest 0.01 g with a calibrated, electronic balance (Dillon D-Terminator,
Dillon Precision Products, Inc.).
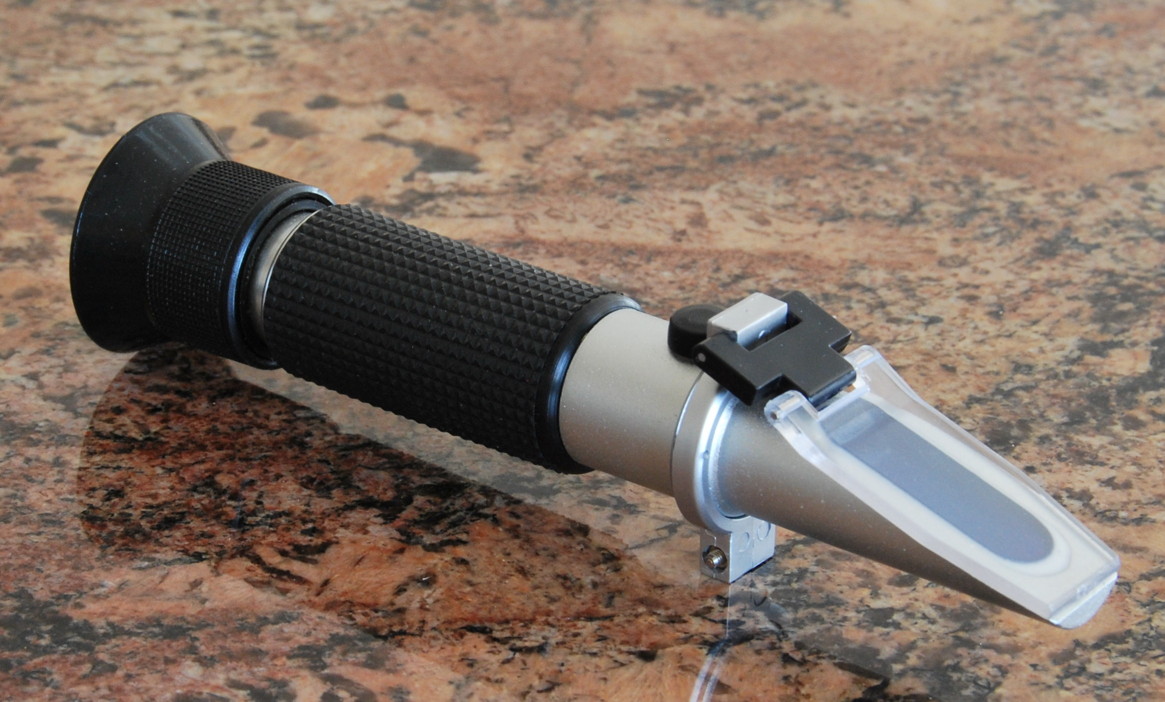
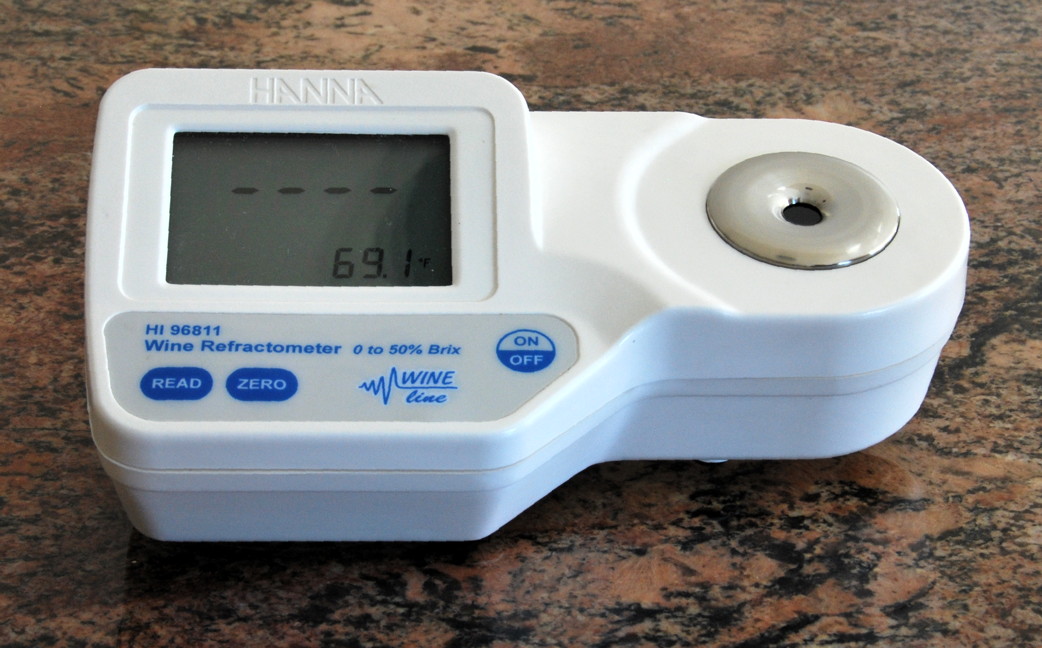
Two refractometers were
employed: (1) a hand-held, analog,
optical model (RHB-32ATC, Huake Instrument Co.); and (2) a bench-top,
digital model (HI-96811, Hanna Instruments). Both nominally report to 0.1 Brix; both are
automatically temperature-compensated (ATC) to report Brix at 20˚C, the
standard temperature at which Brix is usually reported/referenced. [This difference in standard
reference temperatures (15˚C for %ABV & hydrometer measurements, versus
20˚C for Brix refractometry) is not a problem, so
long as reference temperatures are clearly reported. Since the refractometers
were at approximately the same temperature as the samples, virtually no time-lag ensued between sample addition to either instrument
and stable, ATC readings.] Both refractometers were zeroed against distilled water, and
this was checked frequently throughout the analytical period.
A background, 5 g sucrose/100 mL concentration was chosen to mimic the residual extract expected at the end of fermentation in brewing. Samples were prepared by delivering 5.00 g of sucrose to a volumetric flask; adding distilled water to dissolve the sucrose; adding the desired volume of EtOH (15˚C); and diluting to 100 mL (15˚C) with additional water. To address concerns that the background sucrose solution might not adequately mimic wort, I also performed standard additions of EtOH to a commercial beer (Budweiser). To keep the background concentration of beer constant (on a % volume basis) in the presence of different volumes of added EtOH, I used the beer at 80% strength (by volume). Thus, the samples were constructed by measuring out 80 mL of beer in a graduated cylinder; adding the desired volume of EtOH; then diluting to 100 mL with distilled water in a volumetric flask. All components were at 15˚C when delivered.
Results
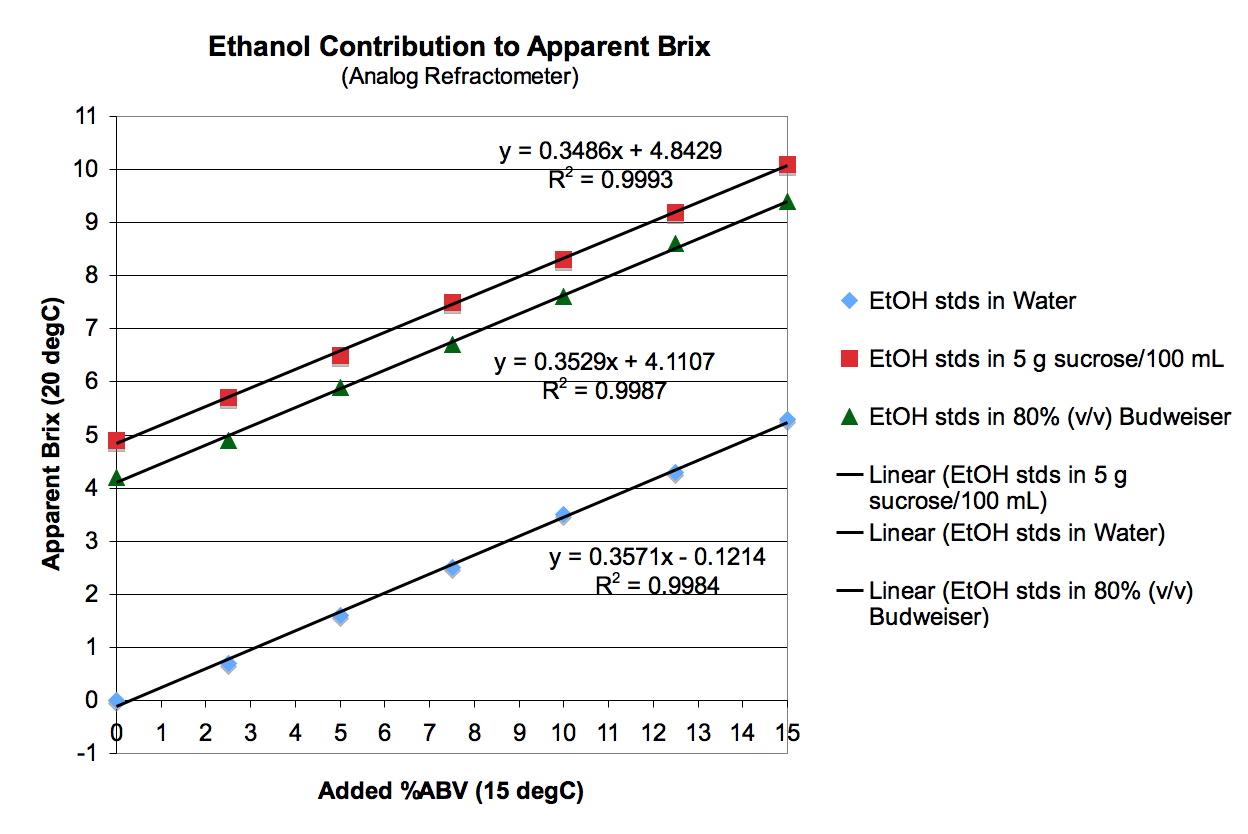
Figure 1. Apparent Brix (20˚C) vs. added %ABV (15˚C) under three conditions: in water; in an aqueous, constant background of 5 g sucrose/100 mL; and in a constant background of 80% (v/v) Budweiser beer.
Figure 1 shows that the incremental contribution of EtOH to apparent Brix was independent of the background matrix – i.e., all three regression lines have virtually the same slope. This is important, because it demonstrates
that we are operating in a range where refractive index contributions are
predictably additive among components.
At high concentrations of EtOH
(and presumably of sugars or wort extract),
non-linear behavior is expected.
For example, Figure 2 shows how refractive index is affected by %ABW in
water. At
levels of EtOH expected in brewing, linearity exists;
at levels of EtOH expected in distilled spirits, a
non-linear relationship commences between refractive index and %ABW.
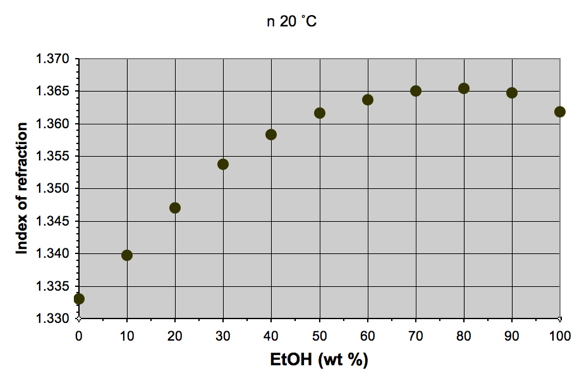
Figure 2. Effect of EtOH concentration (in water) on index of refraction. [Data from Taschenbuch für Chemiker und Physiker (D'Ans-Lax ), Band 2: Organische Verbindungen. Springer (1983). ISBN 978-3-540-12263-0, Geb.].
The experiment depicted in Figure 1 was replicated
four times with both analog and digital Brix refractometers. The grand mean slope from all trials
gives a conversion factor:
0.353 Brix (20˚C) per %ABV (15˚C)
Or, expressed per %ABW:
0.445 Brix (20˚C) per %ABW
This latter conversion factor was obtained from the
former by: 0.353*(1.000)/0.794, where a SG of
1.000 was assumed (as not atypical for the end of fermentation in brewing) and
0.794 is the density of EtOH at 15˚C.
Measuring %ABV Using Brix Refractometry
The reliable contribution that %ABV
makes to apparent Brix suggests a method to measure %ABV in fermenting wort or finished beers. A Brix
reading is taken on a sample; the EtOH
is then driven off by boiling a known volume of sample down to 20 – 25%
of its initial volume; the residue
is reconstituted to its original volume with distilled water; and a final Brix reading is made. The difference in Brix (pre-boil vs. post-boil,
reconstituted) is divided by the previously determined conversion factor of
0.353 to determine %ABV in the original sample.
![]()
For a first test of this method, the EtOH
standards in aqueous solutions of 5 g sucrose/100 mL were used. A sample of 100 mL was obtained in a
100-mL volumetric flask at 15˚C.
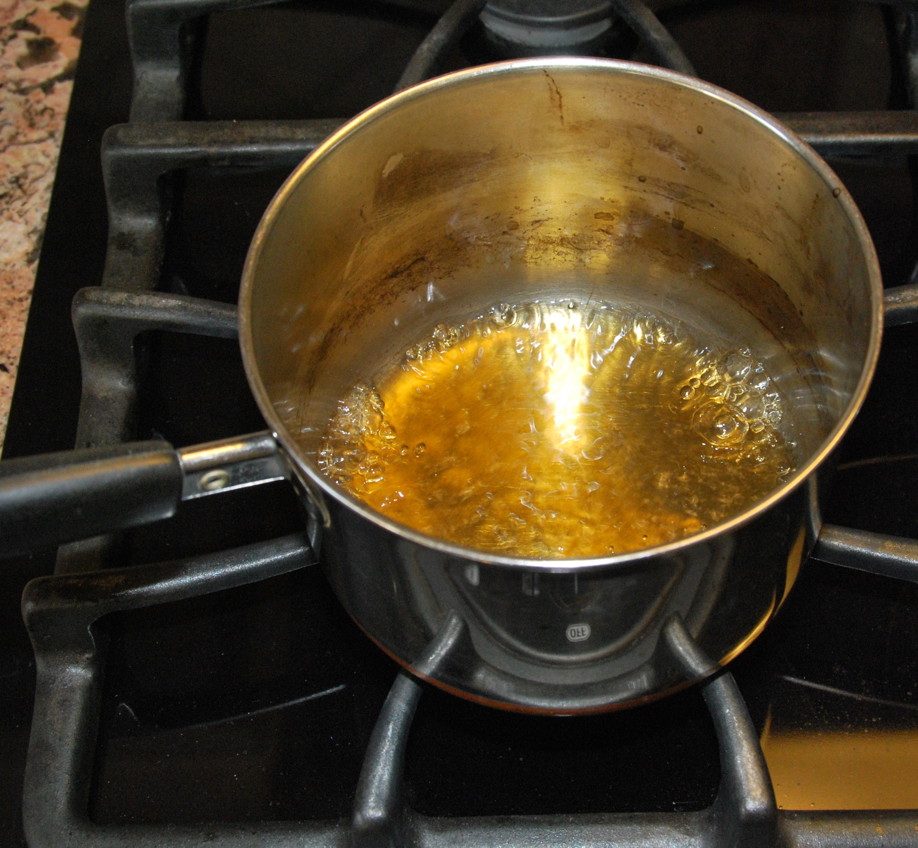
This was transferred to a small, stainless-steel
saucepan, with excess distilled water used (via squirt bottle) to thoroughly
rinse the sample from the volumetric flask into the pan. The sample in the pan was boiled until
only 20 - 25 mL remained (see image above-left -- but note that this shows boiling beer, not EtOH/sucrose standards). This
remnant was transferred back to the volumetric flask, with distilled water
rinses of the pan (via squirt bottle) to insure complete transfer back to the
flask (see image above-right). The liquid in the flask was
then diluted to 100 mL with additional distilled water. The flask contents were mixed by
repeated inversion. The flask was
placed in a 15˚C water bath to equilibrate. The drop in temperature caused the fluid
level in the flask to drop below the 100-mL line; therefore distilled water was
added to bring it back up to the mark, insuring that the boiled sample was
reconstituted to 100 mL at 15˚C.
The liquid in the flask was mixed again, and Brix was measured on this reconstituted sample.
%ABVoriginal sample = (Brixoriginal sample – Brixreconsttd aftr boil)
/ 0.353
Results are shown in Figure 3 for EtOH
standards in a background of 5 g sucrose/100 mL.
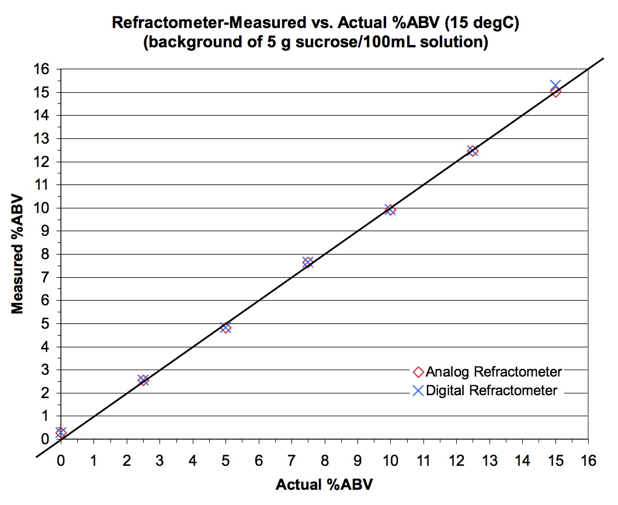
Figure 3.
Test of Brix-based method for measuring %ABV.
The method appears to work
quite well. It is, of course,
limited by the precision of Brix measurements (among other factors). The method uses the computed difference
(∆Brix) between two Brix measurements, and the typical Brix refractometer
reports only to the nearest 0.1 Brix.
A 0.1 deviation in ∆Brix propagates to a deviation of 0.1/0.353 = 0.28 %ABV.
The data in Figure 3 suggest a precision higher than expected: mean
error is 0.05 %ABV and sample standard deviation (n=14) is 0.16 %ABV.
One hypothetical concern is that, unlike with the EtOH/sucrose solutions depicted in Figure 3, authentic wort might have non-EtOH constituents whose contributions to apparent Brix could undergo change during the boiling step used with the analytical method. The method relies on a premise that the ∆Brix between original and boiled/reconstituted samples is solely due to the loss of EtOH from the boil. To address this concern, a second test of the analytical method was performed, using standard additions of EtOH to an 80%(v/v)-strength sample of a commercial beer (Budweiser). The resulting ∆Brix values (original – boiled/reconstituted) were then divided by the previously determined conversion factor [0.353 Brix (20˚C) per %ABV (15˚C)] to provide an analytical estimate of the %ABV in the samples. Results are shown in Figure 4.
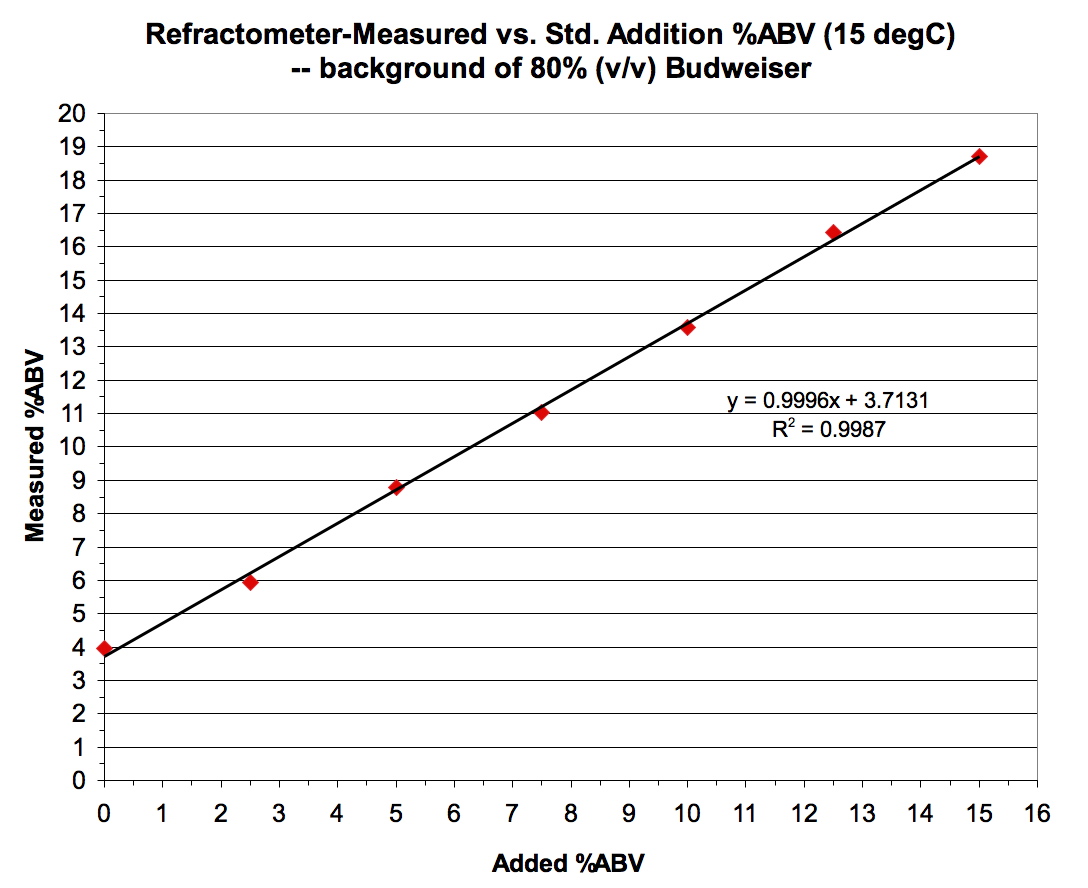
Figure 4. Brix-based analytical method for %ABV applied to standard additons of EtOH in 80%(v/v) Budweiser beer.
That the slope of the regression line in Figure 4 is essentially 1.000 means that the 0.353 conversion factor between incremental Brix and incremental %ABV is valid – which is unsurprising since the regression slope in Figure 1 for these standards in 80%(v/v) beer was 0.353. It also reflects that I observed the same Brix (2.8) in all six samples after boil/reconstitution, regardless of the amount of standard EtOH addition to the original. This demonstrates that the boiling step successfully removed EtOH from all. The only evidence to be found, here, that this after-boil/reconstitution Brix (2.8) is a good measure of non-EtOH constituents in the unboiled beer is that the method provides a reasonable measure of the %ABV for the Budweiser sample: the 80%(v/v) dilution without added EtOH gave a Brix of 4.2, which computes to a measured %ABV = (4.2 – 2.8)/0.353 = 4.0 %ABV, meaning that the original, undiluted sample is 5.0 %ABV. This agrees with the reported %ABV for this beer.
In a final application of the method, I applied it to the measurement of %ABV in samples of two distilled spirits: Gordon's Vodka and Jim Beam Kentucky Bourbon, both of which report "80 Proof" on the bottle, which is 40 %ABV. I diluted each four-fold before analysis, to get the EtOH content down into the range within which method evaluations had been performed. Results for both gave 40.8% as the ABV of the undiluted spirits. It's interesting to note that after boiling and reconstitution of samples during analysis, both gave Brix readings of zero. There's very little in the spirits besides EtOH and water.
Finally, a comment about the refractometers used: In all respects,
the hand-held, analog refractometer performed as well
as the bench-top, digital refractometer. The hand-held model uses smaller samples
(an advantage) but is more difficult to read (a disadvantage). On the other hand, the hand-held, analog
model tends to provide the user with feedback when problems develop that
limit precision. For example, some
dark and turbid samples will give rather fuzzy lines of demarcation when one
tries to read the analog scale.
Often this fuzziness gets worse with time as the sample sits on the glass slide, presumably as solids settle
or gas bubbles form. The fuzziness of the demarcation line serves as a kind of warning to the user. The digital
instrument gives the user no such feedback: a button is pressed, and Brix numerals appear on an LCD
screen; the instrument is doing the optical reading, not the user. I rather like knowing when I am
encountering difficult samples.

![]() Stoichiometry Derivation of Calculator Equations
Stoichiometry Derivation of Calculator Equations ![]()